Yahya Moradi Chaleshtori, Geophysicist; Elham Parsamanesh, Geophysicist; Mehdi Mohammad Hassani, Geophysics Lead; Amir Mollajan, Geophysicist
Introduction
The study of hydrocarbon reservoirs using numerical analysis methods and the extraction of various seismic indicators is an important solution for determining hydrocarbon layers.
By using seismic indicators, numerous inherent seismic features are determined both from the point of view of the structural geology and the physical parameters of the sub-strata. In this way, geological phenomena are clearly described by using different indicators due to the difference in their different seismic responses, whose effect is evident in the quality of seismic data. Although seismic indicators are not sensitive to specific geological phenomena, the content of the frequency amplitude and phase components of seismic data are the main factors for determining physical characteristics such as reflection coefficients, velocity and absorption, and the shape and geometric position of geological structures.
During the 1970s and 1980s, the seismic attributes most used in petroleum exploration were amplitude-based instantaneous attributes. However, in the 1990s, seismic attribute technology dramatically advanced in several directions; techniques now range from single-trace instantaneous event attribute computations to more complex multi-trace windowed seismic event attribute extractions to the generation of seismic attribute volumes. Applications run from simple amplitude anomaly detection to monitoring fluid front movement over time.
Summary
In this study, a combination of two indicators, one based on frequency content and the other based on amplitude, is used to identify gas anomalies such as gas chimneys and gas packets.
Local frequency attribute measures seismic signal characteristics not instantaneously, but locally in the surrounding of each point. Regularized inversion is used for defining local frequency. A shaping regularization is applied for controlling the locality and smoothness of local frequency.
The trace envelope measures the instantaneous amplitude of a seismic signal. The envelope of seismic signals is independent of the phase and may be related directly to a variety of other trace attributes. The trace envelope of a seismic signal may represent the individual interface contrast or, the combined response of several interfaces, depending on the seismic bandwidth. The trace envelope is a physical attribute and can be used as an effective discriminator for characteristics such as bright spots, possible gas accumulation, unconformities, major changes in lithology, lateral changes indicating faulting, spatial correlation to porosity, and other lithologic variations.
- Definition of local frequency
The definition of the local frequency attribute can be recognized by a regularized form of linear inversion. By a general regularization operator R, the definition for local frequency will be as follows:
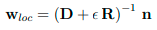 (1)
(1)
The role of the regularization operator is to ensure the continuity and smoothness of the local frequency measure. A different approach to regularization follows from the shaping method (Fomel, 2006). Shaping regularization operates with a smoothing (shaping) operator S by incorporating it into the inversion scheme as follows:
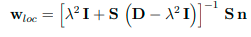 (2)
(2)
Scaling by λ preserves physical dimensionality and enables fast convergence when inversion is implemented by an iterative method. A natural choice for λ is the least-squares norm of D.
- Definition Instantaneous amplitude (envelope)
The instantaneous amplitude (or envelope) is usually defined as the magnitude of the (complex-valued) analytic signal Xa(t) associated with the given signal X(t):
Xa(t) = X(t) + iH{X(t)} (3)
where H denotes the Hilbert transform. So, the envelope of X(t) is given by |Xa(t)|.
- Real Example
The two mentioned indicators were applied on two seismic sections related to two gas fields in the south of Iran located in the Persian Gulf. The obtained results show the probability of gas accumulation in the reservoir area of both data schematically.
Figure 1. Calculating local frequency (A), and trace envelop (B) for measuring the probability of gas accumulation (C)
Figure 2. Calculating local frequency (A), and trace envelop
Conclusions
This paper discusses the characteristics of two seismic indicators and their combination that are useful as a tool for drawing conclusions from seismic data interpretation. Although there are many seismic indicators, here we try to use indicators that are very important in detecting gas anomalies as one of the most important geological features. Although these markers may not provide definitive information on this, they are a very useful tool for analyzing this trait. It should be kept in mind that the combined use of some indicators together can have meaningful and useful results.
References
- Chen, Q., and S. Sidney, 1997, Seismic attribute technology for reservoir forecasting and monitoring: The Leading Edge, 16, 445{456.
- Chopra, S., and K. J. Marfurt, 2005, Seismic attributes {A historical perspective: Geophysics, 70, 3SO {28SO.
- Fomel, S., Local seismic attributes: Geophysics, 72, no. 3, A29-A33, 2007.
- Bedrosian, E. (December 1962). A product theorem for Hilbert transforms (PDF) (Report). Rand Corporation. RM-3439-PR.
- Khvedelidze, B. V. (2001) [1994], "Hilbert transform", Encyclopedia of Mathematics, EMS Press